


The first version of my analytics dashboard showed one number prominently: task completion rate. It looked great. It told me almost nothing useful.
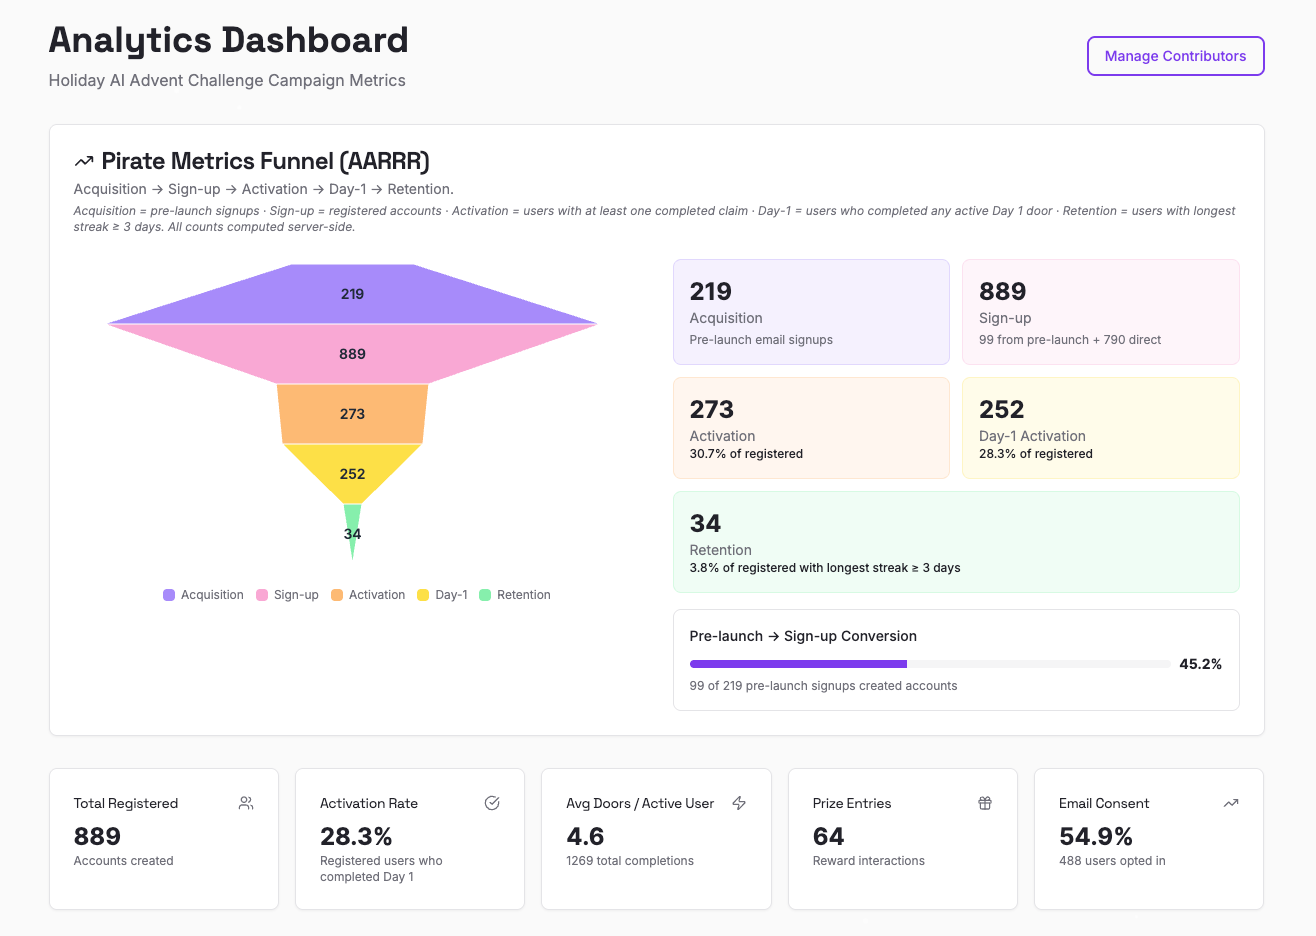
I replaced it with a AARRR pirate metrics model built directly into the database, and the numbers it surfaced were honest in a way that the completion rate was not.
Here is the full model and why each decision matters.
Why I Abandoned the Completion Rate Metric
“100% task completion rate” is the kind of metric that sounds meaningful in a pitch deck and reveals nothing about your product in practice.
The problem with task completion as a top-line metric for a 25-day challenge: it flattens the distribution. A player who opened every door and skimmed every lesson has the same completion flag as someone who spent 45 minutes on each one. A player who completed Day 1 through Day 7 and then dropped off has a non-zero completion rate, but they are not the same as someone who finished Day 25.
I needed a metric that told me whether the sequential unlock architecture was working. Whether players were actually building a daily practice. Whether the challenge was producing the behavior it was designed for, not just recording that some interaction had occurred.
The AARRR model gave me that.
The Full Funnel
All five funnel stages are computed server-side by a single SECURITY DEFINER RPC called get_admin_analytics(). The RPC is admin-gated, which means the calculation happens in the database with service-role permissions. No client-side aggregation, no hitting the Supabase 1,000-row row limit that breaks naive client queries on large tables.
Here is what each stage measures and where the data comes from:
Acquisition tracks pre-launch email signups. Anyone who submitted their email before December 1 and is tagged with the current edition in the profiles table. This is the top of the funnel: people who were interested enough to raise their hand before the challenge was live.
Sign-up tracks registered accounts in the current edition. The RPC also splits this into converted_from_prelaunch (people who signed up after receiving a pre-launch email) and direct_signups (people who arrived through other channels). That split tells me which acquisition channel was actually converting.
Activation tracks distinct users with at least one claim in the claims table. A player is activated the moment they complete their first door. The day1_completions sub-metric narrows this to players who specifically completed a Day 1 door. The Day 1 rate is the most important activation signal because it tells you whether the onboarding experience is working. In 2025, that number was 42%.
Retention tracks users with a longest_streak >= 3 in the streaks table. Three consecutive days is the threshold I chose because one-day spikes are noise and two-day clusters are still often trial behavior. Three days in a row signals that the sequential unlock is working as a habit-formation mechanism, not just as a novelty.
Referral tracks the distribution of signup_source values in the profiles table. UTM parameters are captured from the URL on first visit and written to sessionStorage. At signup, the auth trigger reads them from raw_user_meta_data and persists them to the profile. That gives me utm_source, utm_medium, utm_campaign, and the referrer_host for every user who came through a tracked link.
The Metric I’m Most Honest About
The retention number is the one I watch with the most scrutiny, because the AI Advent Challenge runs in December.
December is the worst possible month for a streak-based engagement product. It is the highest-conflict calendar month of the year. Holidays, travel, end-of-year work pressure, family obligations. A challenge that requires daily action for 25 consecutive days is fighting against all of that.
I knew this when I chose the launch window. The December timing was a deliberate product decision, not an oversight. The challenge is themed as an advent calendar. The seasonal framing is part of what makes it compelling. But it also means I accept a retention curve that would look different in a lower-friction month.
I track both the overall retention rate and an “active-only” streak distribution that filters to players who completed at least three doors. That distribution shows me the engagement quality of my most committed users separate from the overall population drop-off.
avg_doors_per_active Replaced the Vanity Metric
The single metric change I am most satisfied with was replacing “task completion rate” with avg_doors_per_active: the average number of doors completed per activated user.
This metric distributes engagement across the funnel rather than collapsing it to a binary. A player who completed 18 doors scores higher than one who completed 3. The average across all activated players tells me how deep the challenge content is pulling people, not just whether the first door worked.
It is also honest about failure modes. If avg_doors_per_active drops between editions, it tells me that early content is working but mid-challenge engagement is breaking down. If it is high but the Day 1 rate is low, it tells me the challenge is retaining well once people start but there is a top-of-funnel problem.
Both signals are actionable. Neither requires guessing.
Door-Level Performance Data
The analytics dashboard surfaces door_stats: claim counts per door. This tells me which days performed well and which fell flat.
In 2025, the mid-challenge doors (roughly Day 10 through Day 18) had lower claim counts than the early and late doors. Some of that is natural drop-off. Some of it is content quality variation across 37 different contributors. The door-level data lets me go back and see which specific contributors’ content held engagement versus where players disengaged.
For the 2026 edition, I am using that data to make better content decisions: more guidance to contributors on challenge structure, closer alignment between the lesson and the challenge task, and a review of doors where time-spent was significantly lower than average.
UTM Capture and the Attribution Problem
884 players from before I fixed the UTM capture implementation show up as “Direct (untracked)” in the referral distribution. That data is not backfillable. The session was not preserved from their first visit and the signup trigger had nothing to write to profiles.
I fixed the implementation before the bulk of signups came in. But the first wave of players, often the most enthusiastic early adopters, has incomplete attribution data.
I am not going to pretend that limitation does not exist. It is in the product spec. The analytics dashboard labels those users honestly. And the fix that prevents it from happening again is in production.
Register for 2026
The AI Advent Challenge runs every December. If you want to participate in the 2026 edition or apply to contribute a door, get on the list now.